


Published on Aug 16, 2019
Updated on Oct 16, 2019
Create superior customer experiences to enhance competitive advantage.
Go from zero to breakthrough with scalable, future-proof solutions.
Harness deep tech for smarter solutions and maximum impact.
Accelerate value delivery with powerful pre-built digital tools.
Help businesses connect with an internet first generation.
Test the smarter way: where precision meets efficiency.
Unlock real-time and personalized customer journeys for mobile first generation.
Turn data into decisive action with scalable AI infrastructure.
Design agile digital foundations that scale with tomorrow's business needs.
Build new-age architecture for maximum efficiency and hyper-growth.
Fine-tune your cloud infrastructure for peak performance.
Automated compliance and control for global regulations.

All
Customer Experience
Mantra
Application Development
Insurtech
Digital Health
Insurance
Deep-Tech
AgriTech(1)
Augmented Reality(21)
Clean Tech(9)
Customer Journey(17)
Design(45)
Solar Industry(8)
User Experience(68)
Edtech(10)
Events(34)
HR Tech(3)
Interviews(10)
Life@mantra(11)
Logistics(6)
Manufacturing(5)
Strategy(18)
Testing(9)
Android(48)
Backend(32)
Dev Ops(11)
Enterprise Solution(33)
Technology Modernization(9)
Frontend(29)
iOS(43)
Javascript(15)
AI in Insurance(41)
Insurtech(67)
Product Innovation(59)
Solutions(22)
E-health(12)
HealthTech(25)
mHealth(5)
Telehealth Care(4)
Telemedicine(5)
Artificial Intelligence(154)
Bitcoin(8)
Blockchain(19)
Cognitive Computing(8)
Computer Vision(8)
Data Science(24)
FinTech(51)
Banking(7)
Intelligent Automation(27)
Machine Learning(48)
Natural Language Processing(14)
Even when the customer has successfully added items to cart, it all means zilch until the purchase is complete. The average cart abandonment rate for all sectors worldwide was 75.6% last year. Simply put three out of every four digital customers leave websites without completing the purchase.
At the customer acquisition phase, you’ve to compete with zero-profit offers, despite the fact that your product is the best in its niche.
Although 80% of businesses claim they offer a great customer experience, only about 8% of customers express satisfaction with their experience.
So, what went wrong? Why are customers leaving your site without purchasing? And more importantly, what can you do about it?
Mastering the art of understanding user persona, discovering bottlenecks in the delivery process, and designing a user-friendly interface will help you build the product that supersedes customers’ expectations.
It involves understanding your customers’ behavior and feelings throughout their interaction with your products/services and visually mapping them to tell a complete story of their overall experience.
More precisely, the journey begins from the moment they first come to know about your product and the phases they pass through while making a final purchase decision.
“For brands, customer journey mapping is like walking a mile in their customers’ shoes and understanding their circumstances with empathy.”
Apart from managing complex user experience problems, you can tweak customer journeys to understand past, present or a future state surrounding a day in the life of your customer.
According to Gartner, Eighty-two percent of organizations have created a customer journey map, but only 47% are using those maps effectively. The mapping of the customer journey begins by creating a cross-functional team led by the CIO, CMO or even the CEO.
A journey map is different from process maps. They detail multiple channels and touchpoints before and during the buying process. Interestingly, the more value-added layers you can include, the better is your view of your customer.

Source: Uxpressia
Adding convenience to the customer experience value chain can create powerful moments of truth. For instance, while shopping on your portal, a customer might want to know more information about your product, it’s features, reviews, etc.
A proactive service that goes to the customer first using real-time messaging and custom product recommendations, is how innovative solutions can address such pain points, impacting the overall experience.
Before we look at how to select the most relevant inputs for outlining behavior, it’s important to grasp the fact that customer journey mapping is an iterative process. For instance, the questions answered by customer journey maps a decade ago is totally different from today.
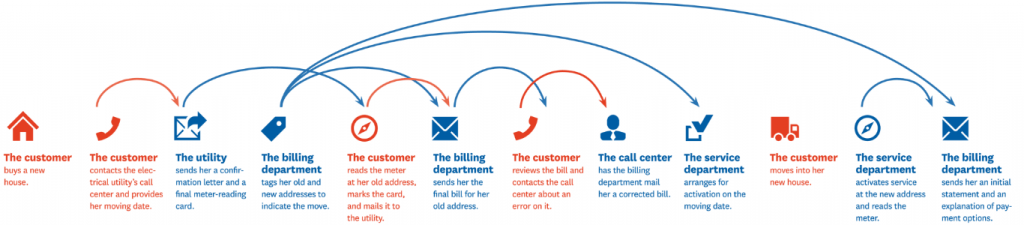
Source: Harvard Business Review | Linear customer journey map in 2010
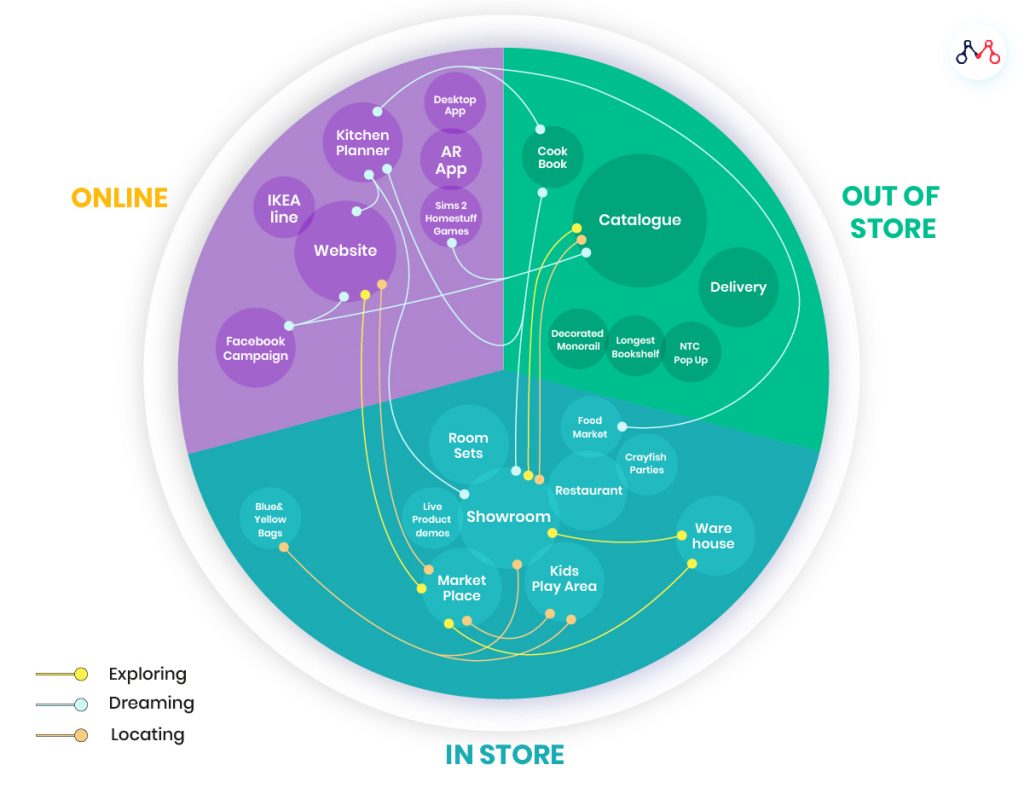
Source: Medium | The present-day non-linear customer journey map (eg: Ikea)
The goal is to build a comprehensive map that will conclusively identify gaps from multiple touchpoints — areas of customer experience that are disjointed or painful.
To achieve this, it is vital to map out each phase of the pre-buying and actual buying journey and map them alongside data-driven personas. Data is critical for customer journey stages — it is almost impossible to create customer journey maps without it.
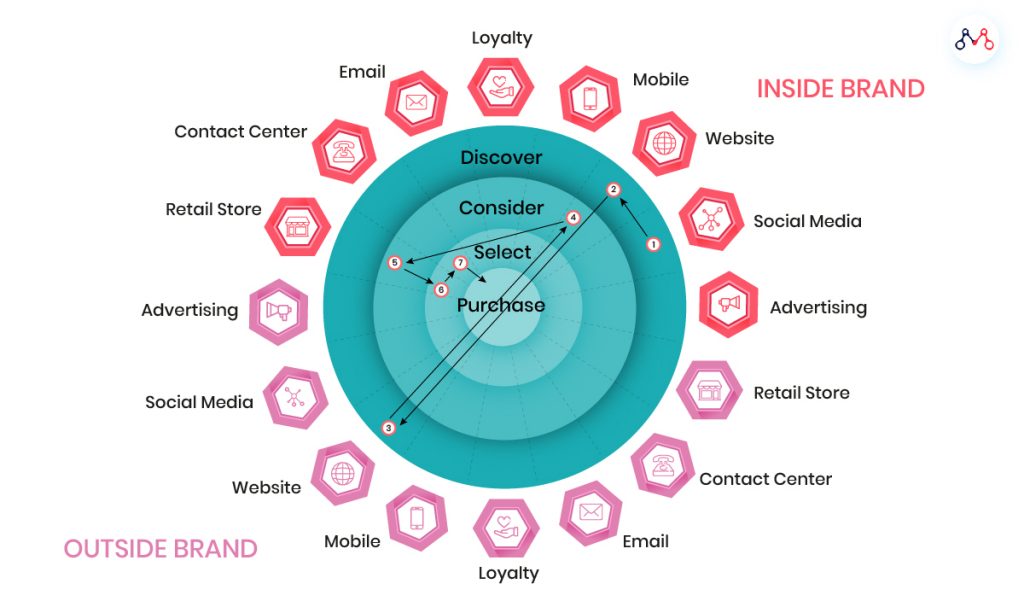
The Modern Customer Journey
Source: G3 Com
The modern customer journey map needs to cover the complete omnichannel experience. Customers are now communicating with companies through 10 channels on average. Their expectations are fast-moving and rapidly evolving. They expect communications about the latest products from their favorite brands to happen in real-time.
For instance, Magalu, one of Brazil’s largest retail companies, recognized that its app was growing in popularity. They decided to enable deep linking, so that loyal customers who tapped on a Magalu ad were taken directly to the mobile app they already have installed, resulting in more than 40 percent growth in overall mobile purchases.
Customer journey maps are drawn from the customer’s point of view and are based on people’s mental models (how things should behave, the flow of interactions and possible touchpoints). They combine user personas, user scenarios & user flows to understand and predict how the customer will behave next.
You’re doing great if you understand your customers and are able to exceed their expectations. Retaining a loyal customer base might make you think about the essence of understanding the customer journey.
But, how are you planning to face the competitive landscape? Because customers constantly lookout for change. What if your competitors satisfy your customer’s needs with a better emotional connection? Mapping the customer journey will allow you to transform the experience delivery process creating ‘wow’ moments that strengthen loyalty.
“The term ‘customer experience’ won’t exist in the organization of the future. It will be deeply entrenched in a company’s product, process, and culture that it will be synonymous with the brand and represent the only way to do business.”
Ann Lewnes, EVP and CMO, Adobe
We specialize in helping organizations build attractive and easy-to-understand user journey maps for faster omnichannel integration. Reach out to us on hello@mantralabsglobal.com, to learn more.
Knowledge thats worth delivered in your inbox
Smart Manufacturing starts with real-time visibility.
Manufacturing companies today generate data by the second through sensors, machines, ERP systems, and MES platforms. But without real-time insights, even the most advanced production lines are essentially flying blind.
Manufacturers are implementing real-time dashboards that serve as control towers for their daily operations, enabling them to shift from reactive to proactive decision-making. These tools are essential to the evolution of Smart Manufacturing, where connected systems, automation, and intelligent analytics come together to drive measurable impact.
Data is available, but what’s missing is timely action.
For many plant leaders and COOs, one challenge persists: operational data is dispersed throughout systems, delayed, or hidden in spreadsheets. And this delay turns into a liability.
Real-time dashboards help uncover critical answers:
By converting raw inputs into real-time manufacturing analytics, dashboards make operational intelligence accessible to operators, supervisors, and leadership alike, enabling teams to anticipate problems rather than react to them.
Line performance and downtime trends
Track OEE in real time and identify underperforming lines.
Predictive maintenance alerts
Utilize historical and sensor data to identify potential part failures in advance.
Inventory heat maps & reorder thresholds
Anticipate stockouts or overstocks based on dynamic reorder points.
Quality metrics linked to operator actions
Isolate shifts or procedures correlated with spikes in defects or rework.
These insights allow production teams to drive day-to-day operations in line with Smart Manufacturing principles.
Role-based dashboards
Dashboards can be configured for machine operators, shift supervisors, and plant managers, each with a tailored view of KPIs.
Embedded alerts and nudges
Real-time prompts, like “Line 4 below efficiency threshold for 15+ minutes,” reduce response times and minimize disruptions.
Cross-functional drill-downs
Teams can identify root causes more quickly because users can move from plant-wide overviews to detailed machine-level data in seconds.
Data lakehouse integration
Unified access to ERP, MES, IoT sensor, and QA systems—ensuring reliable and timely manufacturing analytics.
ETL pipelines
Real-time data ingestion from high-frequency sources with minimal latency.
Visualization tools
Custom builds using Power BI, or customized solutions designed for frontline usability and operational impact.
Mantra Labs partnered with a North American die-casting manufacturer to unify its operational data into a real-time dashboard. Fragmented data, manual reporting, delayed pricing decisions, and inconsistent data quality hindered operational efficiency and strategic decision-making.
As this case shows, real-time dashboards are not just operational tools—they’re strategic enablers.
(Learn More: Powering the Future of Metal Manufacturing with Data Engineering)
| Aspect | What You Should Know |
| 1. Why Static Reports Fall Short | Delayed insights after issues occur Disconnected systems (ERP, MES, sensors) No real-time alerts or embedded decision logic |
| 2. What Real-Time Dashboards Enable | Track OEE and downtime in real-time Predictive maintenance using sensor data Dynamic inventory heat maps Quality linked to operators |
| 3. Dashboards That Drive Action | Role-based views (operator to CEO) Embedded alerts like “Line 4 down for 15+ mins” Drilldowns from plant-level to machine-level |
| 4. What Powers These Dashboards | Unified Data Lakehouse (ERP + IoT + MES) Real-time ETL pipelines Power BI or custom dashboards built for frontline usability |
Smart Manufacturing dashboards aren’t just analytics tools—they’re productivity engines. Dashboards that deliver real-time insight empower frontline teams to make faster, better decisions—whether it’s adjusting production schedules, triggering preventive maintenance, or responding to inventory fluctuations.
Explore how Mantra Labs can help you unlock operations intelligence that’s actually usable.
Knowledge thats worth delivered in your inbox


Our Sales Team will be in touch with you shortly.

Hello Stranger! Please fill in a few details,and you’ll receive a link to this case study.
 We have mailed you this case study.
Thanks for subscribing.
